GPSwise Interference Analytics: Practical Tools for Monitoring GPS Spoofing
We have added a new paid add-on to GPSwise called Interference Analytics.
Its goal is simple: help you see when and where GNSS spoofing and jamming events happen, and what they mean for flights in a given airspace or fleet.
It’s an interactive dashboard, and users can download plots or export the occurrences table to CSV with a single click.
Use-case 1: Monitoring GPS spoofing in a particular area
Air Navigation Service Providers, Civil Aviation Authorities, or Spectrum Monitoring Agencies can now easily investigate GPS spoofing events in detail.
Example : June 30, 2025 — Mexico FIR (MMFR)
On June 30, 2025, GPSwise detected 10 spoofed flights in the Mexico Flight Information Region (FIR). To review the event, the user can open the interference analytics page, search for MMFR as the FIR, and select the corresponding date or period.

GPSwise Interference Analytics search for GPS spoofing on June 30, 2025, in Mexico FIR.
Once retrieved, the results include:,
A Map showing the position of the flights impacted by the GPS interference.
A Frequency Analysis plot showing the event occurrences hourly, daily, or weekly.
A Table showing details of all the flights impacted by the GPS spoofing.
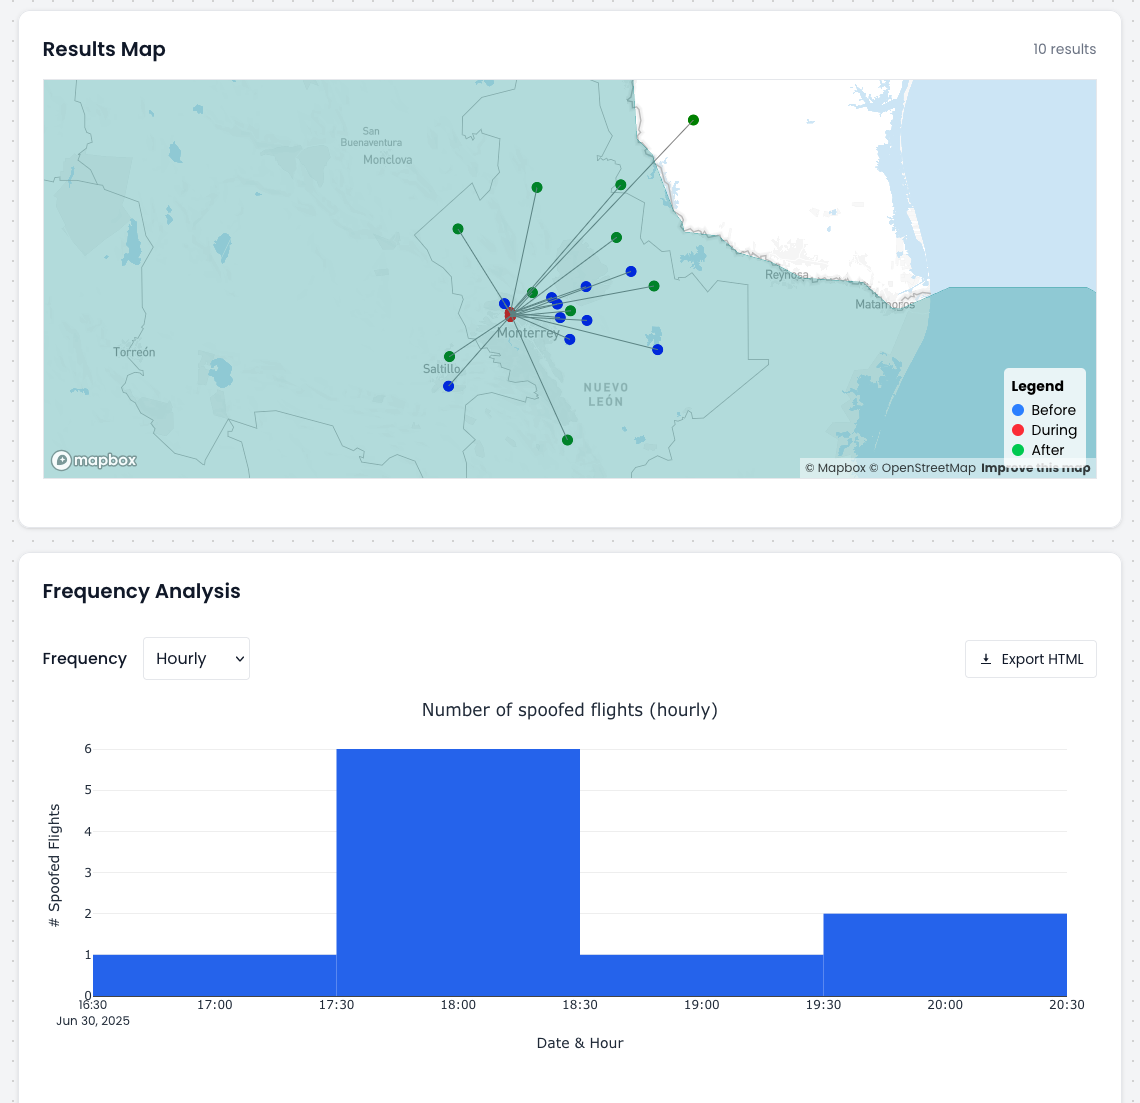
GPSwise Interference Analytics results for the GPS spoofing near Monterrey, Mexico.
The map shows the impacted area was around the city of Monterrey, and flights were spoofed to a position close to the Aeropuerto AFL Parque Industrial Mitras.
From this, we can see:
First spoofed flight at 17 UTC
Peak activity around 18 UTC with six spoofed flights in one hour
Last spoofed flight detected at 20 UTC
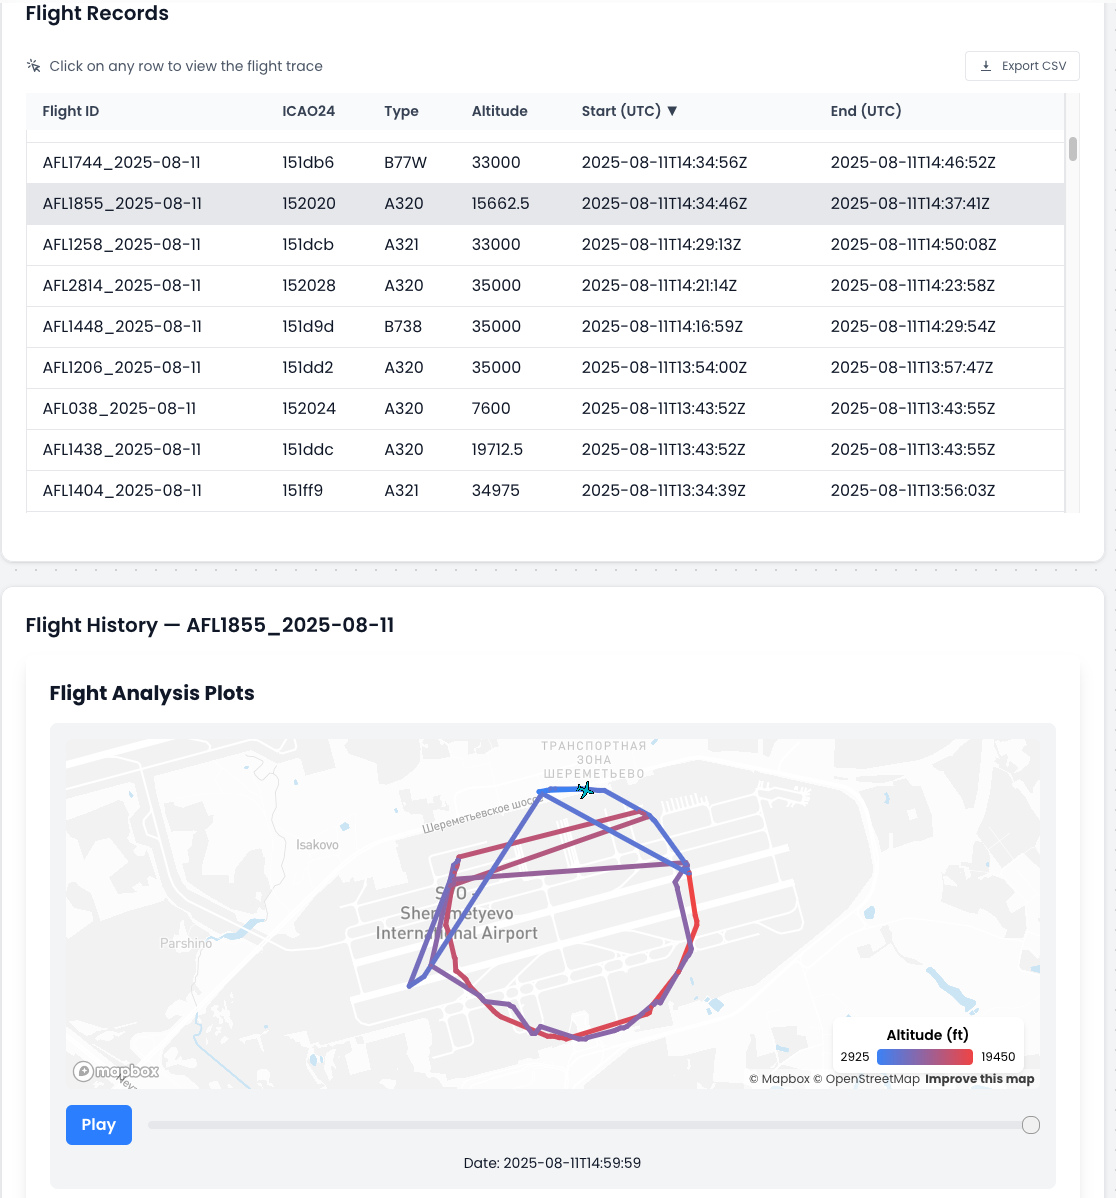
Below the Frequency Analysis plot, a table with the affected flights provides more details.

GPSwise Interference Analytics results for the GPS spoofing near Monterrey, Mexico.
Users can select any row to display the flight trace and replay the trajectory. For example, VTM356 jumped suddenly from the Saltillo area to Monterrey, then returning to the correct position past Saltillo, a clear spoofing signature.
Use-case 2: Monitoring a Fleet
With GPSwise Interference Analytics, airlines can track spoofing and jamming incidents affecting their own fleet. Searches can be run by callsign pattern or a list of ICAO24 hex codes to see relevant flights.
Example: Tracking the spoofing of Aeroflot
It is possible to track the spoofing of the Aeroflot fleet for the last 7 days, using the search with the AFL callsign prefix.
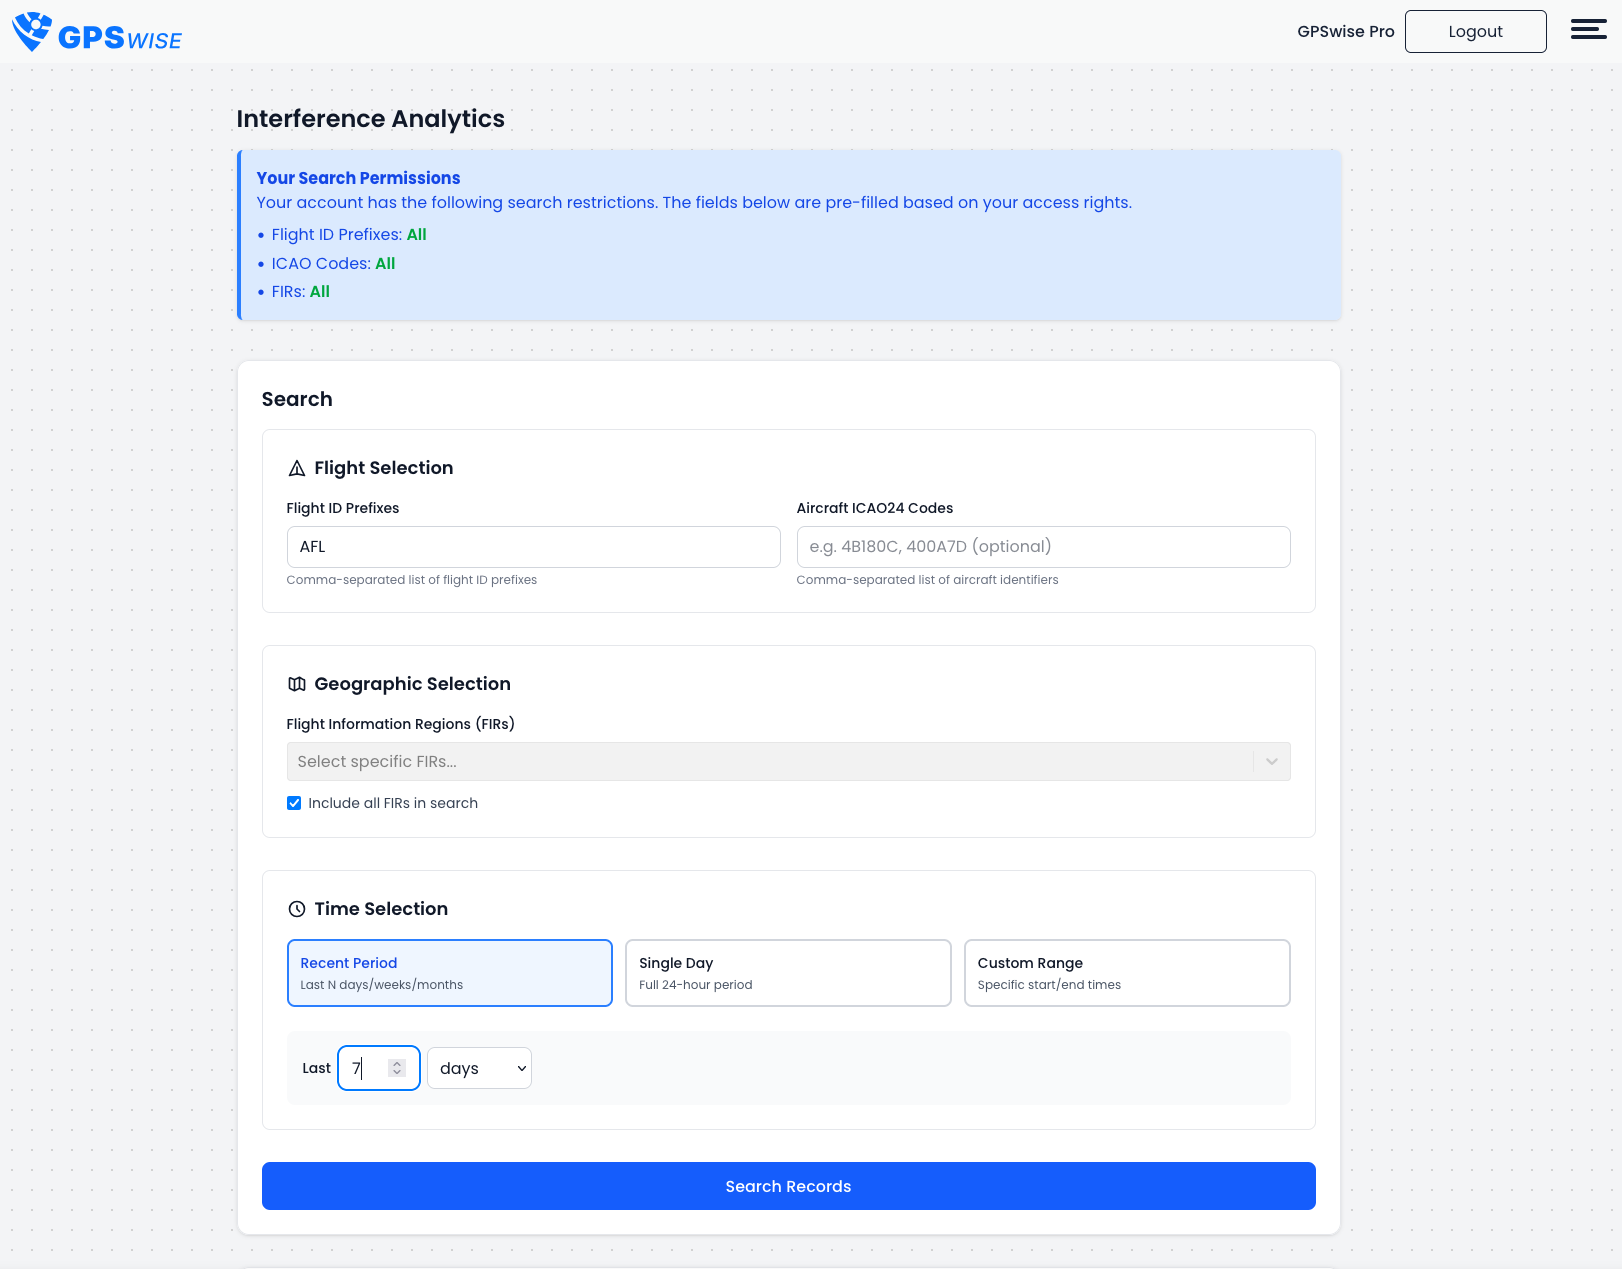
GPSwise Interference Analytics search for GPS spoofing of the Aeroflot fleet for the last 7 days.
Once the records are retrieved, the Map shows where the Aeroflot fleet was impacted by the GPS interference, as well as a Frequency Analysis plot which shows that between 150 and 200 flights were impacted by GPS spoofing every day.
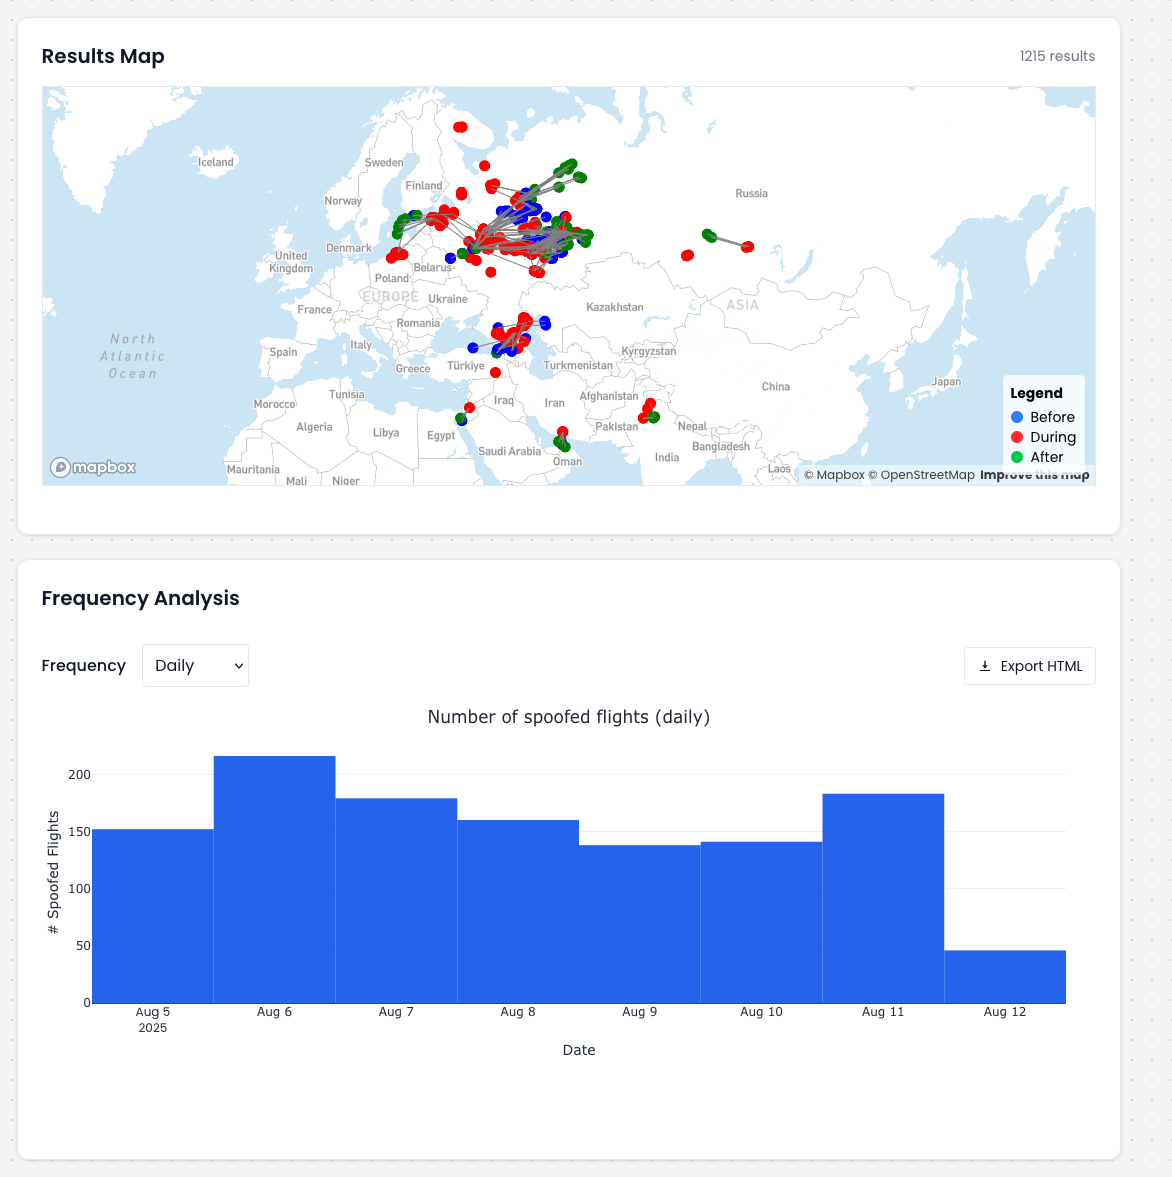
The user can also investigate each occurrence one by one by analyzing the ADS-B trace.
Summary
Interference Analytics brings together:
Geographical monitoring for ANSPs, CAAs and intelligence agencies.
Fleet-wide monitoring for airlines and operators.
Frequency analysis to see when incidents occur or identify patterns.
Flight-by-flight analysis with trajectory replay.
It’s designed to be a practical tool whether you’re looking into a past incident or monitoring ongoing activity.